
Echarts 高级版本
图表混搭
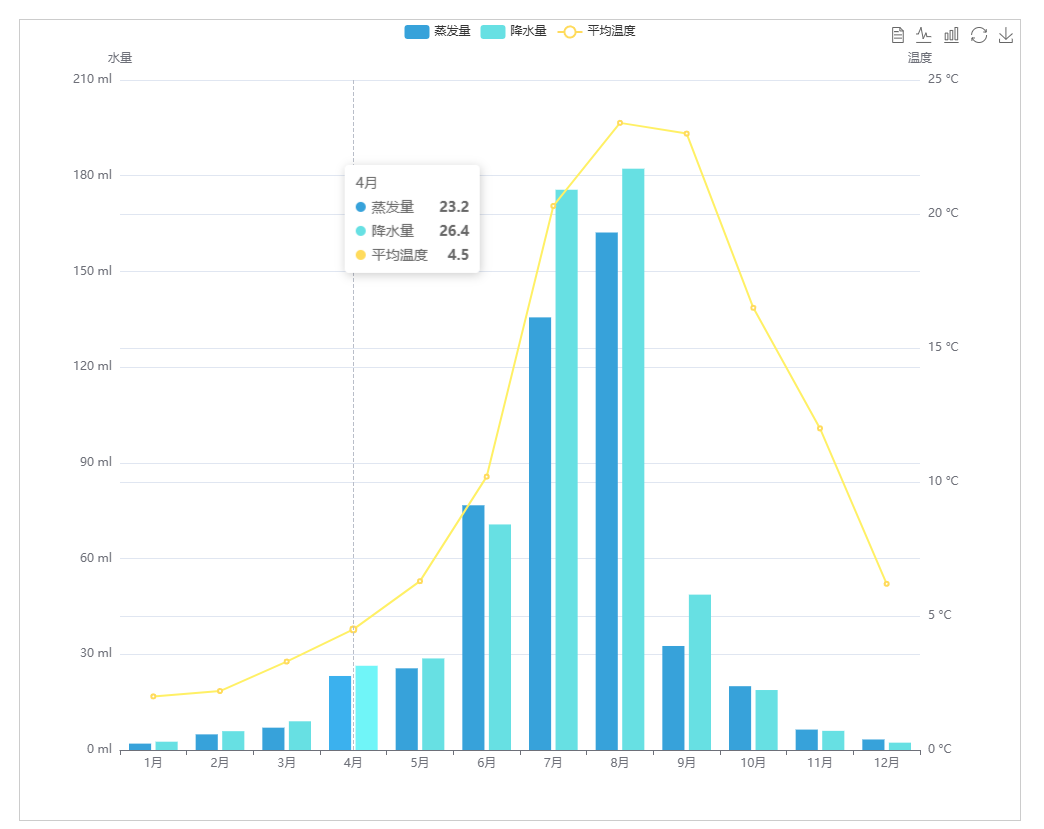
双轴 需要两个 Y 轴
效果图
代码
html
<template>
  <div class="page">
    <div class="title">电压瞬时波峰图</div>
    <div id="main"></div>
  </div>
</template>

<script setup>
  import * as echarts from "echarts";

  import { ref, onMounted, onBeforeUnmount, markRaw } from "vue";

  const myChart = ref(null);

  onMounted(() => {
    echartinit();
  });

  onBeforeUnmount(() => {
    window.removeEventListener("resize", function () {
      myChart.value.resize();
    });
  });

  const echartinit = () => {
    // 找到Echart元素
    const chartDom = document.getElementById("main");

    // 默认的时候支持light或者dark两种样式 必须引入markRaw 取消数据响应
    myChart.value = markRaw(echarts.init(chartDom, "light"));

    // 加载地图

    // 指定图表的配置项和数据
    // 指定图表的配置项和数据

    let options = {
      tooltip: {
        trigger: "axis",
      },
      toolbox: {
        show: true,
        feature: {
          mark: { show: true },
          dataView: { show: true, readOnly: false },
          magicType: { show: true, type: ["line", "bar"] },
          restore: { show: true },
          saveAsImage: { show: true },
        },
      },
      calculable: true,
      legend: {
        data: ["蒸发量", "降水量", "平均温度"],
      },
      xAxis: [
        {
          type: "category",
          data: [
            "1月",
            "2月",
            "3月",
            "4月",
            "5月",
            "6月",
            "7月",
            "8月",
            "9月",
            "10月",
            "11月",
            "12月",
          ],
        },
      ],
      yAxis: [
        {
          type: "value",
          name: "水量",
          axisLabel: {
            formatter: "{value} ml",
          },
        },
        {
          type: "value",
          name: "温度",
          axisLabel: {
            formatter: "{value} °C",
          },
        },
      ],
      series: [
        {
          name: "蒸发量",
          type: "bar",
          data: [
            2.0, 4.9, 7.0, 23.2, 25.6, 76.7, 135.6, 162.2, 32.6, 20.0, 6.4, 3.3,
          ],
        },
        {
          name: "降水量",
          type: "bar",
          data: [
            2.6, 5.9, 9.0, 26.4, 28.7, 70.7, 175.6, 182.2, 48.7, 18.8, 6.0, 2.3,
          ],
        },
        {
          name: "平均温度",
          type: "line",
          yAxisIndex: 1,
          data: [
            2.0, 2.2, 3.3, 4.5, 6.3, 10.2, 20.3, 23.4, 23.0, 16.5, 12.0, 6.2,
          ],
        },
      ],
    };

    myChart.value.setOption(options);
    // 监听改变大小
    window.addEventListener("resize", function () {
      myChart.value.resize();
    });
  };
</script>

<style lang="scss" scoped>
  .page {
    overflow: hidden;
    .title {
      font-size: 16px;
      color: black;
      margin: 0 auto;
      text-align: center;
      font-size: 36px;
    }
    #main {
      width: 1000px;
      height: 800px;
      border: 1px solid #ccc;
      margin: 0 auto;
      margin-top: 20px;
    }
  }
</style>