
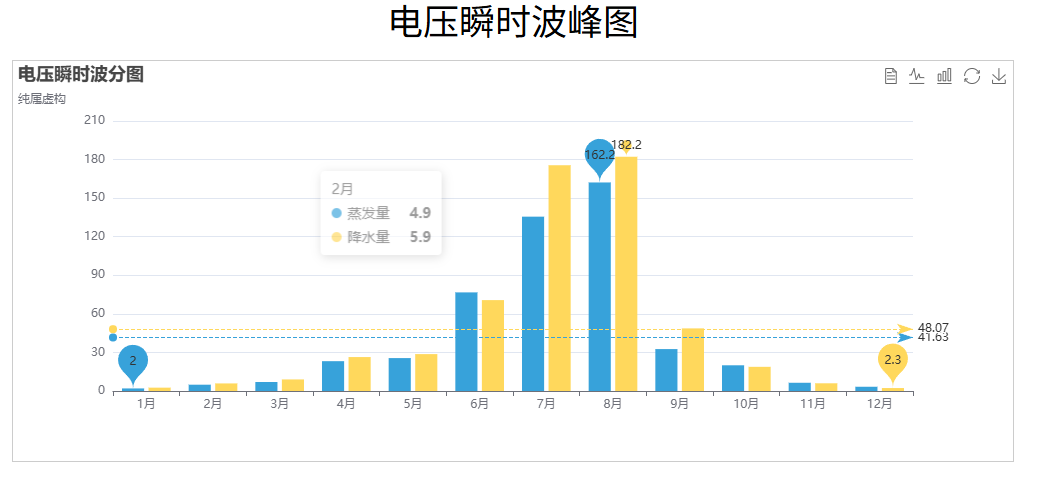
柱状图
效果图
代码
html
<template>
  <div class="page">
    <div class="title">电压瞬时波峰图</div>
    <div id="main"></div>
  </div>
</template>

<script setup>
  import * as echarts from "echarts";
  import { ref, onMounted, onBeforeUnmount, markRaw } from "vue";
  const myChart = ref(null);

  onMounted(() => {
    echartinit();
  });

  onBeforeUnmount(() => {
    window.removeEventListener("resize", function () {
      myChart.value.resize();
    });
  });

  // 设置字体
  const getfontsize = (size) => {
    let clientWidth = document.body.clientWidth;
    return (clientWidth / 1920) * size;
  };

  const echartinit = () => {
    // 找到Echart元素
    const chartDom = document.getElementById("main");

    // 默认的时候支持light或者dark两种样式 必须引入markRaw 取消数据响应
    myChart.value = markRaw(echarts.init(chartDom, "light"));

    // 设置图表得options

    // 指定图表的配置项和数据
    let options = {
      title: {
        text: "电压瞬时波分图",
        subtext: "纯属虚构",
      },
      tooltip: {
        trigger: "axis", //放到轴上的时候才会出现提示,默认是item不会出现轴,只有放到数据上才有提示
      },
      legend: {
        data: ["电压预警", "电流预警"],
      },
      toolbox: {
        show: true,
        feature: {
          mark: { show: true }, //辅助线开关
          dataView: { show: true, readOnly: false }, //把表格切换成数据,readOnly要是true,则只能读
          magicType: { show: true, type: ["line", "bar"] }, //数据视图切换
          restore: { show: true }, //重新还原数据
          saveAsImage: { show: true }, //是否保存为图片
        },
      },
      calculable: true, //拖拽
      xAxis: [
        {
          type: "category", //类别
          data: [
            "1月",
            "2月",
            "3月",
            "4月",
            "5月",
            "6月",
            "7月",
            "8月",
            "9月",
            "10月",
            "11月",
            "12月",
          ],
        },
      ],
      yAxis: [
        {
          type: "value",
        },
      ],
      series: [
        {
          name: "蒸发量",
          type: "bar",
          data: [
            2.0, 4.9, 7.0, 23.2, 25.6, 76.7, 135.6, 162.2, 32.6, 20.0, 6.4, 3.3,
          ],
          markPoint: {
            data: [
              { type: "max", name: "最大值" },
              { type: "min", name: "最小值" },
            ],
          },
          markLine: {
            data: [{ type: "average", name: "平均值" }],
          },
        },
        {
          name: "降水量",
          type: "bar",
          data: [
            2.6, 5.9, 9.0, 26.4, 28.7, 70.7, 175.6, 182.2, 48.7, 18.8, 6.0, 2.3,
          ],
          markPoint: {
            data: [
              {
                name: "年最高",
                value: 182.2,
                xAxis: 7,
                yAxis: 183,
                symbolSize: 18,
              },
              { name: "年最低", value: 2.3, xAxis: 11, yAxis: 3 },
            ],
          },
          markLine: {
            data: [{ type: "average", name: "平均值" }],
          },
        },
      ],
    };
    myChart.value.setOption(options);
    // 监听改变大小
    window.addEventListener("resize", function () {
      myChart.value.resize();
    });
  };
</script>

<style lang="scss" scoped>
  .page {
    overflow: hidden;
    .title {
      font-size: 16px;
      color: black;
      margin: 0 auto;
      text-align: center;
      font-size: 36px;
    }
    #main {
      width: 1000px;
      height: 400px;
      border: 1px solid #ccc;
      margin: 0 auto;
      margin-top: 20px;
    }
  }
</style>