
漏斗图
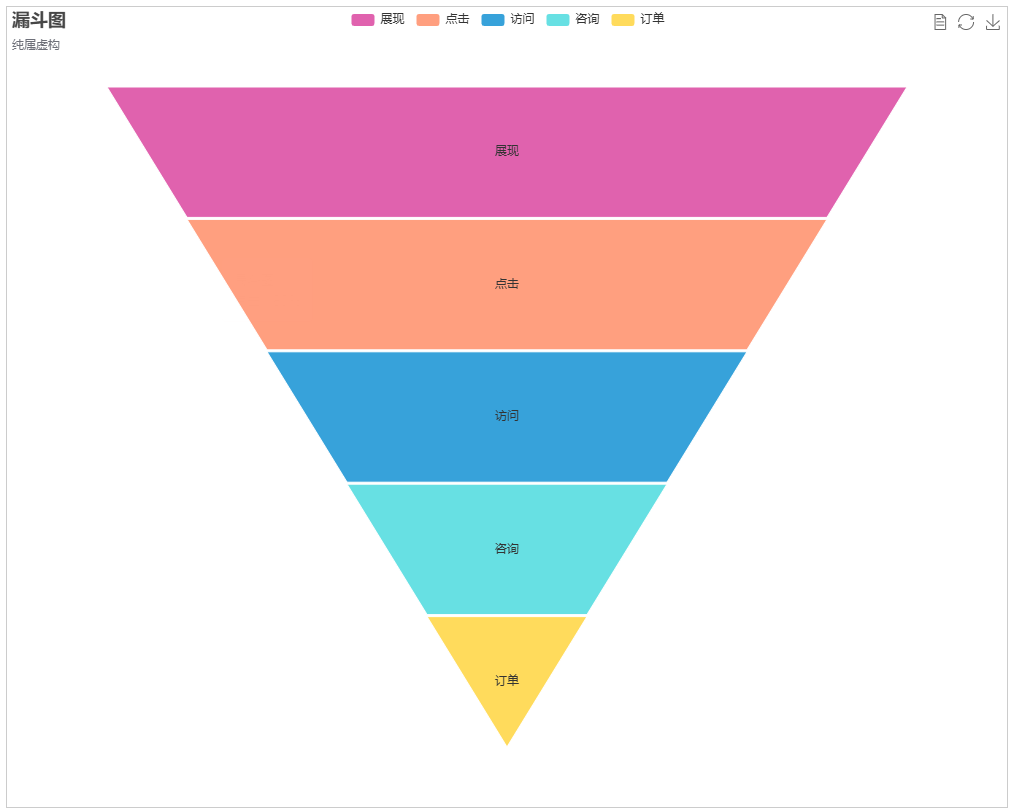
效果图
代码
html
<!--
 * @Author: jsopy
 * @Date: 2025-05-07 14:22:57
 * @LastEditTime: 2025-05-08 15:23:57
 * @FilePath: /demo1/src/pages/index2.vue
 * @Description:
 *
-->
<template>
  <div class="page">
    <div class="title">电压瞬时波峰图</div>
    <div id="main"></div>
  </div>
</template>

<script setup>
  import * as echarts from "echarts";

  import { ref, onMounted, onBeforeUnmount, markRaw } from "vue";

  const myChart = ref(null);

  onMounted(() => {
    echartinit();
  });

  onBeforeUnmount(() => {
    window.removeEventListener("resize", function () {
      myChart.value.resize();
    });
  });

  const echartinit = () => {
    // 找到Echart元素
    const chartDom = document.getElementById("main");

    // 默认的时候支持light或者dark两种样式 必须引入markRaw 取消数据响应
    myChart.value = markRaw(echarts.init(chartDom, "light"));

    // 加载地图

    // 指定图表的配置项和数据
    // 指定图表的配置项和数据

    let options = {
      title: {
        text: "漏斗图",
        subtext: "纯属虚构",
      },
      tooltip: {
        trigger: "item",
        formatter: "{a} <br/>{b} : {c}%",
      },
      toolbox: {
        feature: {
          dataView: { readOnly: false },
          restore: {},
          saveAsImage: {},
        },
      },
      legend: {
        data: ["展现", "点击", "访问", "咨询", "订单"],
      },
      calculable: true,
      series: [
        {
          name: "漏斗图",
          type: "funnel",
          x: "10%", //左上角横坐标
          y: "10%", //左上角纵坐标
          // x2: '80', //右下角横坐标
          // y2: '10%', //右下角结束纵坐标
          // top: 60,
          // //x2: 80,
          // bottom: 60,
          width: "80%",
          // height: {totalHeight} - y - y2,
          min: 0,
          max: 100,
          minSize: "0%",
          maxSize: "100%",
          sort: "descending",
          gap: 2,
          label: {
            show: true,
            position: "inside",
          },
          labelLine: {
            length: 10,
            lineStyle: {
              width: 1,
              type: "solid",
            },
          },
          itemStyle: {
            borderColor: "#fff",
            borderWidth: 1,
          },
          emphasis: {
            label: {
              fontSize: 20,
            },
          },
          data: [
            { value: 60, name: "访问" },
            { value: 40, name: "咨询" },
            { value: 20, name: "订单" },
            { value: 80, name: "点击" },
            { value: 100, name: "展现" },
          ],
        },
      ],
    };

    myChart.value.setOption(options);
    // 监听改变大小
    window.addEventListener("resize", function () {
      myChart.value.resize();
    });
  };
</script>

<style lang="scss" scoped>
  .page {
    overflow: hidden;
    .title {
      font-size: 16px;
      color: black;
      margin: 0 auto;
      text-align: center;
      font-size: 36px;
    }
    #main {
      width: 1000px;
      height: 800px;
      border: 1px solid #ccc;
      margin: 0 auto;
      margin-top: 20px;
    }
  }
</style>