
雷达图
效果
代码
html
<template>
<div class="page">
<div class="title">电压瞬时波峰图</div>
<div id="main"></div>
</div>
</template>
<script setup>
import * as echarts from "echarts";
import { ref, onMounted, onBeforeUnmount, markRaw } from "vue";
const myChart = ref(null);
onMounted(() => {
echartinit();
});
onBeforeUnmount(() => {
window.removeEventListener("resize", function () {
myChart.value.resize();
});
});
// 设置字体
const getfontsize = (size) => {
let clientWidth = document.body.clientWidth;
return (clientWidth / 1920) * size;
};
const echartinit = () => {
// 找到Echart元素
const chartDom = document.getElementById("main");
// 默认的时候支持light或者dark两种样式 必须引入markRaw 取消数据响应
myChart.value = markRaw(echarts.init(chartDom, "light"));
// 设置图表得options
// 指定图表的配置项和数据
// 指定图表的配置项和数据
let options = {
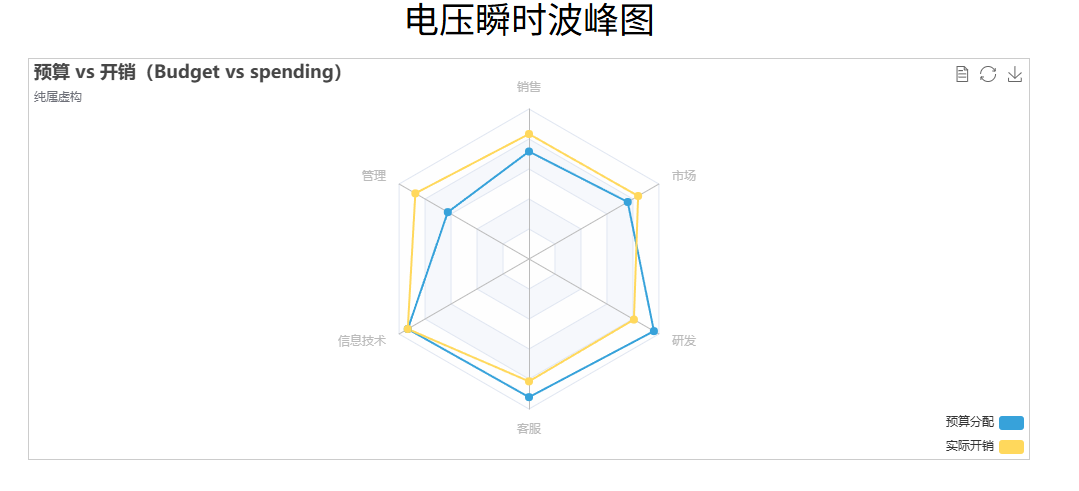
title: {
text: "预算 vs 开销(Budget vs spending)",
subtext: "纯属虚构",
},
tooltip: {
trigger: "axis",
},
legend: {
orient: "vertical",
x: "right",
y: "bottom",
data: ["预算分配", "实际开销"],
},
toolbox: {
show: true,
feature: {
mark: { show: true },
dataView: { show: true, readOnly: false },
restore: { show: true },
saveAsImage: { show: true },
},
},
polar: [
//极坐标
{
indicator: [
//极坐标列表 ,同时也是label内容
{ text: "销售", max: 6000, min: 0 },
{ text: "管理", max: 16000, min: 0 },
{ text: "信息技术", max: 30000, min: 0 },
{ text: "客服", max: 38000, min: 0 },
{ text: "研发", max: 52000, min: 0 },
{ text: "市场", max: 25000, min: 0 },
],
},
],
calculable: true,
series: [
{
name: "预算 vs 开销(Budget vs spending)",
type: "radar",
data: [
//对照上面的数据,顺序不能错
{
value: [4300, 10000, 28000, 35000, 50000, 19000],
name: "预算分配",
},
{
value: [5000, 14000, 28000, 31000, 42000, 21000],
name: "实际开销",
},
],
},
],
};
myChart.value.setOption(options);
// 监听改变大小
window.addEventListener("resize", function () {
myChart.value.resize();
});
};
</script>
<style lang="scss" scoped>
.page {
overflow: hidden;
.title {
font-size: 16px;
color: black;
margin: 0 auto;
text-align: center;
font-size: 36px;
}
#main {
width: 1000px;
height: 400px;
border: 1px solid #ccc;
margin: 0 auto;
margin-top: 20px;
}
}
</style>