
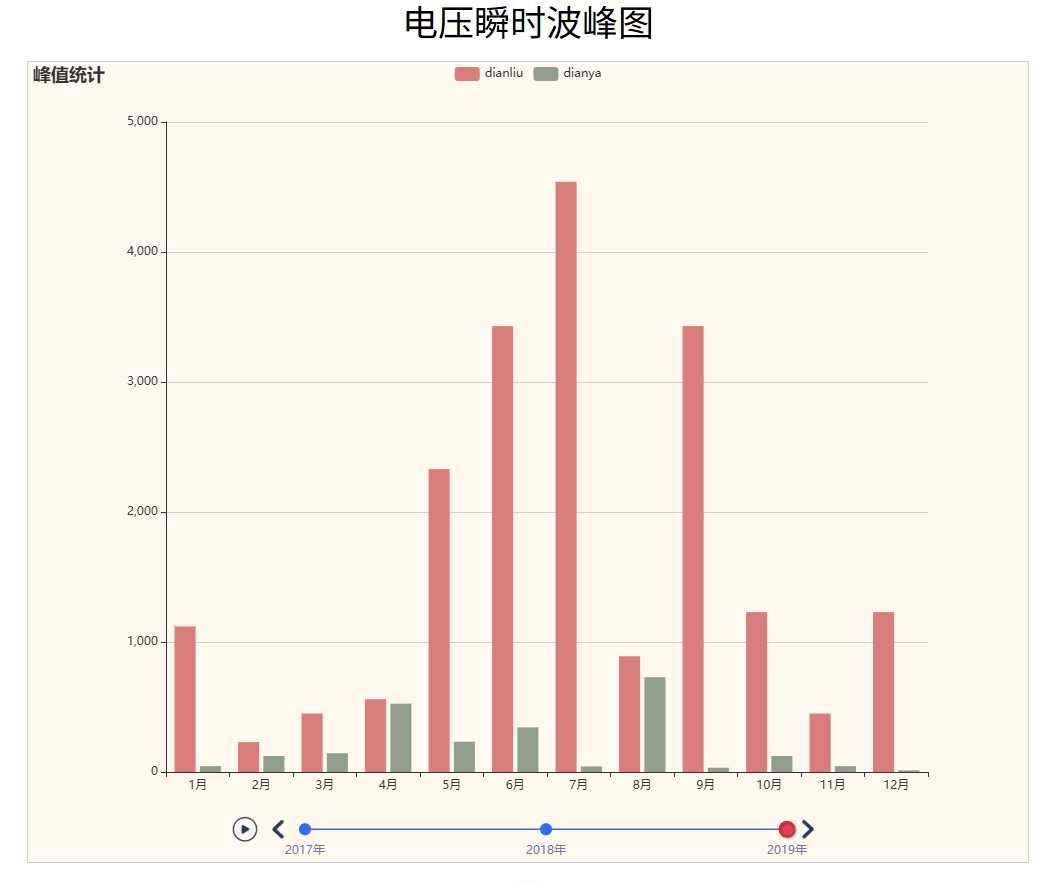
时间轴
效果图
代码
html
<template>
  <div class="page">
    <div class="title">电压瞬时波峰图</div>
    <div id="main"></div>
  </div>
</template>

<script setup>
  import * as echarts from "echarts";
  import vintage from "@/assets/json/vintage.json";
  import { ref, onMounted, onBeforeUnmount, markRaw } from "vue";

  const myChart = ref(null);

  onMounted(() => {
    echartinit();
  });

  onBeforeUnmount(() => {
    window.removeEventListener("resize", function () {
      myChart.value.resize();
    });
  });

  const echartinit = () => {
    // 找到Echart元素
    const chartDom = document.getElementById("main");

    // 默认的时候支持light或者dark两种样式 必须引入markRaw 取消数据响应
    myChart.value = markRaw(echarts.init(chartDom, vintage));

    // 加载地图

    // 指定图表的配置项和数据
    // 指定图表的配置项和数据

    let option = {
      //必须这样写 先写基础版本的
      baseOption: {
        timeline: {
          axisType: "category",
          show: true,
          autoPlay: true,
          playInterval: 1000,
          data: ["2017年", "2018年", "2019年"],
        },
        grid: { containLabel: true },
        xAxis: [
          {
            type: "category", //坐标轴类型,横轴默认为类目数值轴则参考yAxis
            data: [
              "1月",
              "2月",
              "3月",
              "4月",
              "5月",
              "6月",
              "7月",
              "8月",
              "9月",
              "10月",
              "11月",
              "12月",
            ],
          },
        ],
        yAxis: [
          {
            type: "value", //坐标轴类目类型,纵轴默认就是数值轴
            // boundaryGap: [0.1, 0.1], //坐标轴两端空白策略,数组内数值代表百分比
            splitNumber: 4, // 数值轴,分割段数 ,默认为5
          },
        ],
      },
      //上面是时间轴 下面是基础选项
      options: [
        //2017年
        {
          title: {
            text: "峰值统计", //标题
          },
          tooltip: {
            trigger: "item", //气泡触发类型 默认数据触发 可选为axis
          },
          legend: {
            padding: 5, //图里内边距,单位PX,默认上下左右内边距都是5
            itemGap: 10, // legend 各个item之间的间隔,横向水平间隔,纵向布局为纵向间隔
            data: ["dianliu", "dianya"], //item 名称
          },
          xAxis: [
            {
              type: "category", //坐标轴类型,横轴默认为类目数值轴则参考yAxis
              data: [
                "1月",
                "2月",
                "3月",
                "4月",
                "5月",
                "6月",
                "7月",
                "8月",
                "9月",
                "10月",
                "11月",
                "12月",
              ],
            },
          ],
          yAxis: [
            {
              type: "value", //坐标轴类目类型,纵轴默认就是数值轴
              // boundaryGap: [0.1, 0.1], //坐标轴两端空白策略,数组内数值代表百分比
              splitNumber: 4, // 数值轴,分割段数 ,默认为5
            },
          ],
          series: [
            {
              name: "dianliu", //系列名称
              type: "bar", //折线图
              data: [112, 23, 45, 56, 233, 343, 454, 89, 343, 123, 45, 123],
            },
            {
              name: "dianya", //系列名称
              type: "bar", //折线图
              data: [45, 123, 145, 526, 233, 343, 43, 729, 33, 123, 45, 13],
            },
          ],
        },
        //2018年
        {
          title: {
            text: "峰值统计", //标题
          },
          tooltip: {
            trigger: "item", //气泡触发类型 默认数据触发 可选为axis
          },
          legend: {
            padding: 5, //图里内边距,单位PX,默认上下左右内边距都是5
            itemGap: 10, // legend 各个item之间的间隔,横向水平间隔,纵向布局为纵向间隔
            data: ["dianliu", "dianya"], //item 名称
          },
          xAxis: [
            {
              type: "category", //坐标轴类型,横轴默认为类目数值轴则参考yAxis
              data: [
                "1月",
                "2月",
                "3月",
                "4月",
                "5月",
                "6月",
                "7月",
                "8月",
                "9月",
                "10月",
                "11月",
                "12月",
              ],
            },
          ],
          yAxis: [
            {
              type: "value", //坐标轴类目类型,纵轴默认就是数值轴
              // boundaryGap: [0.1, 0.1], //坐标轴两端空白策略,数组内数值代表百分比
              splitNumber: 4, // 数值轴,分割段数 ,默认为5
            },
          ],
          series: [
            {
              name: "dianliu", //系列名称
              type: "bar", //折线图
              data: [112, 23, 45, 56, 233, 343, 454, 89, 343, 123, 45, 123],
            },
            {
              name: "dianya", //系列名称
              type: "bar", //折线图
              data: [
                450, 1230, 1450, 5260, 2330, 3430, 430, 7290, 330, 1230, 450,
                130,
              ],
            },
          ],
        },
        //2019年
        {
          title: {
            text: "峰值统计", //标题
          },
          tooltip: {
            trigger: "item", //气泡触发类型 默认数据触发 可选为axis
          },
          legend: {
            padding: 5, //图里内边距,单位PX,默认上下左右内边距都是5
            itemGap: 10, // legend 各个item之间的间隔,横向水平间隔,纵向布局为纵向间隔
            data: ["dianliu", "dianya"], //item 名称
          },
          xAxis: [
            {
              type: "category", //坐标轴类型,横轴默认为类目数值轴则参考yAxis
              data: [
                "1月",
                "2月",
                "3月",
                "4月",
                "5月",
                "6月",
                "7月",
                "8月",
                "9月",
                "10月",
                "11月",
                "12月",
              ],
            },
          ],
          yAxis: [
            {
              type: "value", //坐标轴类目类型,纵轴默认就是数值轴
              // boundaryGap: [0.1, 0.1], //坐标轴两端空白策略,数组内数值代表百分比
              splitNumber: 4, // 数值轴,分割段数 ,默认为5
            },
          ],
          series: [
            {
              name: "dianliu", //系列名称
              type: "bar", //折线图
              data: [
                1120, 230, 450, 560, 2330, 3430, 4540, 890, 3430, 1230, 450,
                1230,
              ],
            },
            {
              name: "dianya", //系列名称
              type: "bar", //折线图
              data: [45, 123, 145, 526, 233, 343, 43, 729, 33, 123, 45, 13],
            },
          ],
        },
      ],
    };

    myChart.value.setOption(option);
    // 监听改变大小
    window.addEventListener("resize", function () {
      myChart.value.resize();
    });
  };
</script>

<style lang="scss" scoped>
  .page {
    overflow: hidden;
    .title {
      font-size: 16px;
      color: black;
      margin: 0 auto;
      text-align: center;
      font-size: 36px;
    }
    #main {
      width: 1000px;
      height: 800px;
      border: 1px solid #ccc;
      margin: 0 auto;
      margin-top: 20px;
    }
  }
</style>