
饼图 和 环形图
无嵌套版本
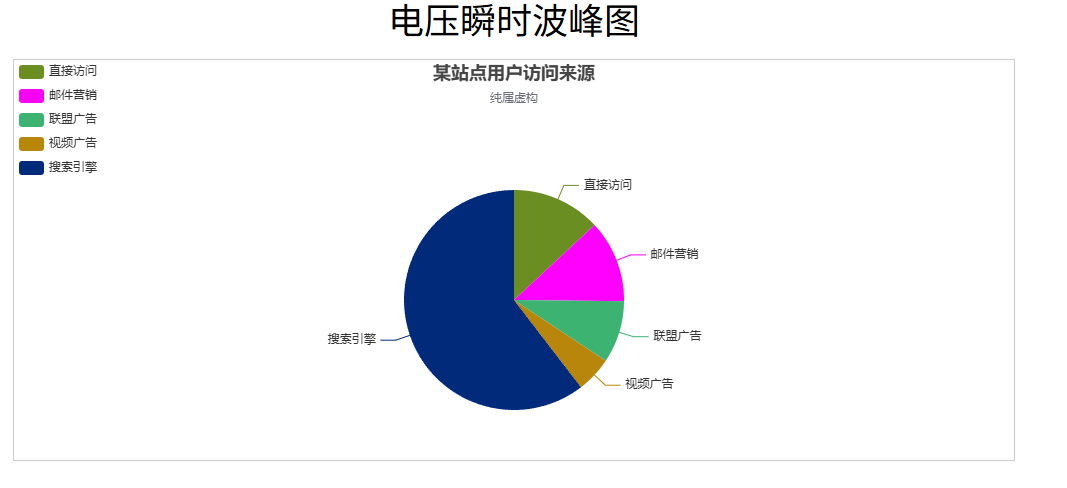
效果
代码
html
<!--
 * @Author: jsopy
 * @Date: 2025-05-07 14:22:57
 * @LastEditTime: 2025-05-08 13:57:53
 * @FilePath: /demo1/src/pages/index2.vue
 * @Description:
 *
-->
<template>
  <div class="page">
    <div class="title">电压瞬时波峰图</div>
    <div id="main"></div>
  </div>
</template>

<script setup>
  import * as echarts from "echarts";
  import { ref, onMounted, onBeforeUnmount, markRaw } from "vue";
  const myChart = ref(null);

  onMounted(() => {
    echartinit();
  });

  onBeforeUnmount(() => {
    window.removeEventListener("resize", function () {
      myChart.value.resize();
    });
  });

  // 设置字体
  const getfontsize = (size) => {
    let clientWidth = document.body.clientWidth;
    return (clientWidth / 1920) * size;
  };

  const echartinit = () => {
    // 找到Echart元素
    const chartDom = document.getElementById("main");

    // 默认的时候支持light或者dark两种样式 必须引入markRaw 取消数据响应
    myChart.value = markRaw(echarts.init(chartDom, "light"));

    // 设置图表得options

    // 指定图表的配置项和数据
    // 指定图表的配置项和数据
    var options = {
      title: {
        text: "某站点用户访问来源",
        subtext: "纯属虚构",
        x: "center",
      },
      color: ["#6b8e23", "#ff00ff", "#3cb371", "#b8860b", "#022A7A"],
      tooltip: {
        trigger: "item",
        //a系列名称 b 数据项名称c数值 d(饼图百分比|雷达图:指示名称)
        formatter: "{a} <br/>{b} : {c} ({d}%)",
      },
      legend: {
        orient: "vertical",
        left: "left",
        data: ["直接访问", "邮件营销", "联盟广告", "视频广告", "搜索引擎"],
      },
      series: [
        {
          name: "访问来源",
          type: "pie",
          radius: "55%", //半径表示图表的大小
          center: ["50%", "60%"], // 圆心的坐标
          data: [
            { value: 335, name: "直接访问" },
            { value: 310, name: "邮件营销" },
            { value: 234, name: "联盟广告" },
            { value: 135, name: "视频广告" },
            { value: 1548, name: "搜索引擎" },
          ],
          itemStyle: {
            emphasis: {
              shadowBlur: 10,
              shadowOffsetX: 0,
              shadowColor: "rgba(0, 0, 0, 0.5)",
            },
          },
        },
      ],
    };
    myChart.value.setOption(options);
    // 监听改变大小
    window.addEventListener("resize", function () {
      myChart.value.resize();
    });
  };
</script>

<style lang="scss" scoped>
  .page {
    overflow: hidden;
    .title {
      font-size: 16px;
      color: black;
      margin: 0 auto;
      text-align: center;
      font-size: 36px;
    }
    #main {
      width: 1000px;
      height: 400px;
      border: 1px solid #ccc;
      margin: 0 auto;
      margin-top: 20px;
    }
  }
</style>有嵌套版本内嵌
- 重点在 series 里面 必须写两个对象了一个是内圆,一个是外圆
效果

代码
html
<template>
  <div class="page">
    <div class="title">电压瞬时波峰图</div>
    <div id="main"></div>
  </div>
</template>

<script setup>
  import * as echarts from "echarts";
  import { ref, onMounted, onBeforeUnmount, markRaw } from "vue";
  const myChart = ref(null);

  onMounted(() => {
    echartinit();
  });

  onBeforeUnmount(() => {
    window.removeEventListener("resize", function () {
      myChart.value.resize();
    });
  });

  // 设置字体
  const getfontsize = (size) => {
    let clientWidth = document.body.clientWidth;
    return (clientWidth / 1920) * size;
  };

  const echartinit = () => {
    // 找到Echart元素
    const chartDom = document.getElementById("main");

    // 默认的时候支持light或者dark两种样式 必须引入markRaw 取消数据响应
    myChart.value = markRaw(echarts.init(chartDom, "light"));

    // 设置图表得options

    // 指定图表的配置项和数据
    // 指定图表的配置项和数据
    var options = {
      tooltip: {
        trigger: "item",
        formatter: "{a} <br/>{b}: {c} ({d}%)",
      },
      legend: {
        orient: "vertical",
        x: "left",
        data: [
          "直达",
          "营销广告",
          "搜索引擎",
          "邮件营销",
          "联盟广告",
          "视频广告",
          "百度",
          "谷歌",
          "必应",
          "其他",
        ],
      },
      series: [
        {
          name: "访问来源",
          type: "pie",
          selectedMode: "single",
          radius: [0, "30%"],

          label: {
            normal: {
              position: "inner",
            },
          },
          labelLine: {
            normal: {
              show: false,
            },
          },
          data: [
            { value: 335, name: "直达", selected: true },
            { value: 679, name: "营销广告" },
            { value: 1548, name: "搜索引擎" },
          ],
        },
        {
          name: "访问来源",
          type: "pie",
          radius: ["40%", "55%"],
          label: {
            normal: {
              formatter: "{a|{a}}{abg|}\n{hr|}\n  {b|{b}:}{c}  {per|{d}%}  ",
              backgroundColor: "#eee",
              borderColor: "#aaa",
              borderWidth: 1,
              borderRadius: 4,
              // shadowBlur:3,
              // shadowOffsetX: 2,
              // shadowOffsetY: 2,
              // shadowColor: '#999',
              // padding: [0, 7],
              rich: {
                a: {
                  color: "#999",
                  lineHeight: 22,
                  align: "center",
                },
                // abg: {
                //     backgroundColor: '#333',
                //     width: '100%',
                //     align: 'right',
                //     height: 22,
                //     borderRadius: [4, 4, 0, 0]
                // },
                hr: {
                  borderColor: "#aaa",
                  width: "100%",
                  borderWidth: 0.5,
                  height: 0,
                },
                b: {
                  fontSize: 16,
                  lineHeight: 33,
                },
                per: {
                  color: "#eee",
                  backgroundColor: "#334455",
                  padding: [2, 4],
                  borderRadius: 2,
                },
              },
            },
          },
          data: [
            { value: 335, name: "直达" },
            { value: 310, name: "邮件营销" },
            { value: 234, name: "联盟广告" },
            { value: 135, name: "视频广告" },
            { value: 1048, name: "百度" },
            { value: 251, name: "谷歌" },
            { value: 147, name: "必应" },
            { value: 102, name: "其他" },
          ],
        },
      ],
    };
    myChart.value.setOption(options);
    // 监听改变大小
    window.addEventListener("resize", function () {
      myChart.value.resize();
    });
  };
</script>

<style lang="scss" scoped>
  .page {
    overflow: hidden;
    .title {
      font-size: 16px;
      color: black;
      margin: 0 auto;
      text-align: center;
      font-size: 36px;
    }
    #main {
      width: 1000px;
      height: 400px;
      border: 1px solid #ccc;
      margin: 0 auto;
      margin-top: 20px;
    }
  }
</style>