
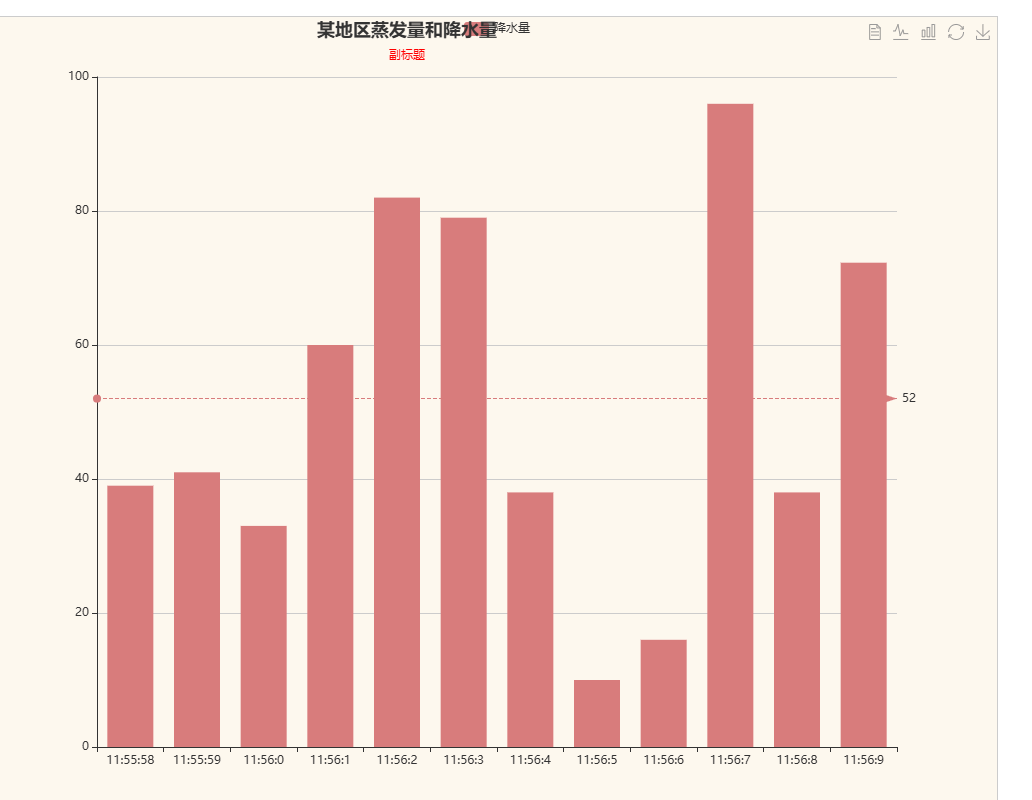
横轴是时间轴,动态改变数据
效果
代码
html
<template>
  <div class="page">
    <div class="title">电压瞬时波峰图</div>
    <div id="main"></div>
  </div>
</template>

<script setup>
  import * as echarts from "echarts";
  import vintage from "@/assets/json/vintage.json";
  import { ref, onMounted, onBeforeUnmount, markRaw } from "vue";

  const myChart = ref(null);

  onMounted(() => {
    echartinit();
  });

  onBeforeUnmount(() => {
    window.removeEventListener("resize", function () {
      myChart.value.resize();
    });
  });
  const randomData = () => {
    var now = new Date();
    var value = Math.random() * 100 + 1;
    return {
      value: [
        [now.getHours(), now.getMinutes(), now.getSeconds()].join(":"),
        Math.round(value),
      ],
    };
  };
  const echartinit = () => {
    // 找到Echart元素
    const chartDom = document.getElementById("main");

    // 默认的时候支持light或者dark两种样式 必须引入markRaw 取消数据响应
    myChart.value = markRaw(echarts.init(chartDom, vintage));

    // 加载地图

    // 指定图表的配置项和数据
    // 指定图表的配置项和数据

    let option = {
      title: {
        text: "某地区蒸发量和降水量",
        subtext: "纯属虚构",
        textAlign: "center", //居中方式 可以是left center right
        subtext: "副标题",
        x: "center",
        subtextStyle: {
          color: "red",
        },
      },
      tooltip: {
        //trigger: 'axis'
        trigger: "item",
      },
      legend: {
        data: ["降水量"],
      },
      toolbox: {
        show: true,
        feature: {
          mark: { show: true },
          dataView: { show: true, readOnly: false },
          magicType: { show: true, type: ["line", "bar"] },
          restore: { show: true },
          saveAsImage: { show: true },
        },
      },
      calculable: true,
      xAxis: [
        {
          type: "category",
          boundaryGap: true,
          splitNumber: 12,
          data: [],
        },
      ],
      yAxis: [
        {
          type: "value",
        },
      ],
      series: [
        {
          name: "降水量",
          type: "bar",
          data: [],
          markLine: {
            data: [{ type: "average", name: "平均值" }],
          },
        },
      ],
    };
    var datax = [];
    var datay = [];
    var num = 0;
    var now = new Date();
    var seconds = now.getSeconds(); //获取到秒
    setInterval(function () {
      var dataall = randomData();
      datax.push(dataall.value[0]);
      datay.push(dataall.value[1]);
      if (datax.length > 12) {
        datax.shift();
        datay.shift();
      }
      option.xAxis[0].data = datax;
      option.series[0].data = datay;
      // 使用刚指定的配置项和数据显示图表。
      myChart.value.setOption(option);
    }, 1000);

    // 监听改变大小
    window.addEventListener("resize", function () {
      myChart.value.resize();
    });
  };
</script>

<style lang="scss" scoped>
  .page {
    overflow: hidden;
    .title {
      font-size: 16px;
      color: black;
      margin: 0 auto;
      text-align: center;
      font-size: 36px;
    }
    #main {
      width: 1000px;
      height: 800px;
      border: 1px solid #ccc;
      margin: 0 auto;
      margin-top: 20px;
    }
  }
</style>