
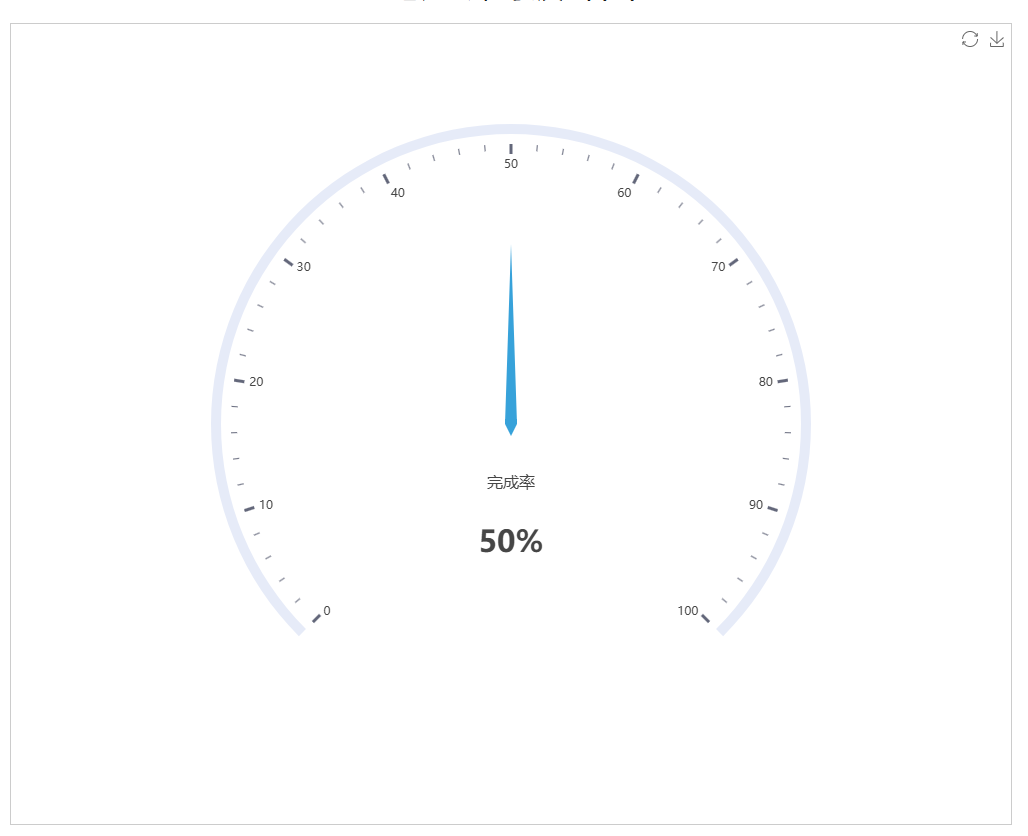
仪表盘
效果
代码
html
<!--
 * @Author: jsopy
 * @Date: 2025-05-07 14:22:57
 * @LastEditTime: 2025-05-08 15:34:53
 * @FilePath: /demo1/src/pages/index2.vue
 * @Description:
 *
-->
<template>
  <div class="page">
    <div class="title">电压瞬时波峰图</div>
    <div id="main"></div>
  </div>
</template>

<script setup>
  import * as echarts from "echarts";

  import { ref, onMounted, onBeforeUnmount, markRaw } from "vue";

  const myChart = ref(null);

  onMounted(() => {
    echartinit();
  });

  onBeforeUnmount(() => {
    window.removeEventListener("resize", function () {
      myChart.value.resize();
    });
  });

  const echartinit = () => {
    // 找到Echart元素
    const chartDom = document.getElementById("main");

    // 默认的时候支持light或者dark两种样式 必须引入markRaw 取消数据响应
    myChart.value = markRaw(echarts.init(chartDom, "light"));

    // 加载地图

    // 指定图表的配置项和数据
    // 指定图表的配置项和数据

    let options = {
      tooltip: {
        formatter: "{a} <br/>{b} : {c}%",
      },
      toolbox: {
        show: true,
        feature: {
          mark: { show: true },
          restore: { show: true },
          saveAsImage: { show: true },
        },
      },
      series: [
        {
          name: "业务指标",
          type: "gauge",
          detail: { formatter: "{value}%" }, //描述详细信息
          data: [{ value: 50, name: "完成率" }],
        },
      ],
    };
    myChart.value.setOption(options);
    // 监听改变大小
    window.addEventListener("resize", function () {
      myChart.value.resize();
    });
    clearInterval(timeTicket);
    var timeTicket = setInterval(function () {
      options.series[0].data[0].value = (Math.random() * 100).toFixed(2) - 0;
      myChart.value.setOption(options, true);
    }, 2000);
  };
</script>

<style lang="scss" scoped>
  .page {
    overflow: hidden;
    .title {
      font-size: 16px;
      color: black;
      margin: 0 auto;
      text-align: center;
      font-size: 36px;
    }
    #main {
      width: 1000px;
      height: 800px;
      border: 1px solid #ccc;
      margin: 0 auto;
      margin-top: 20px;
    }
  }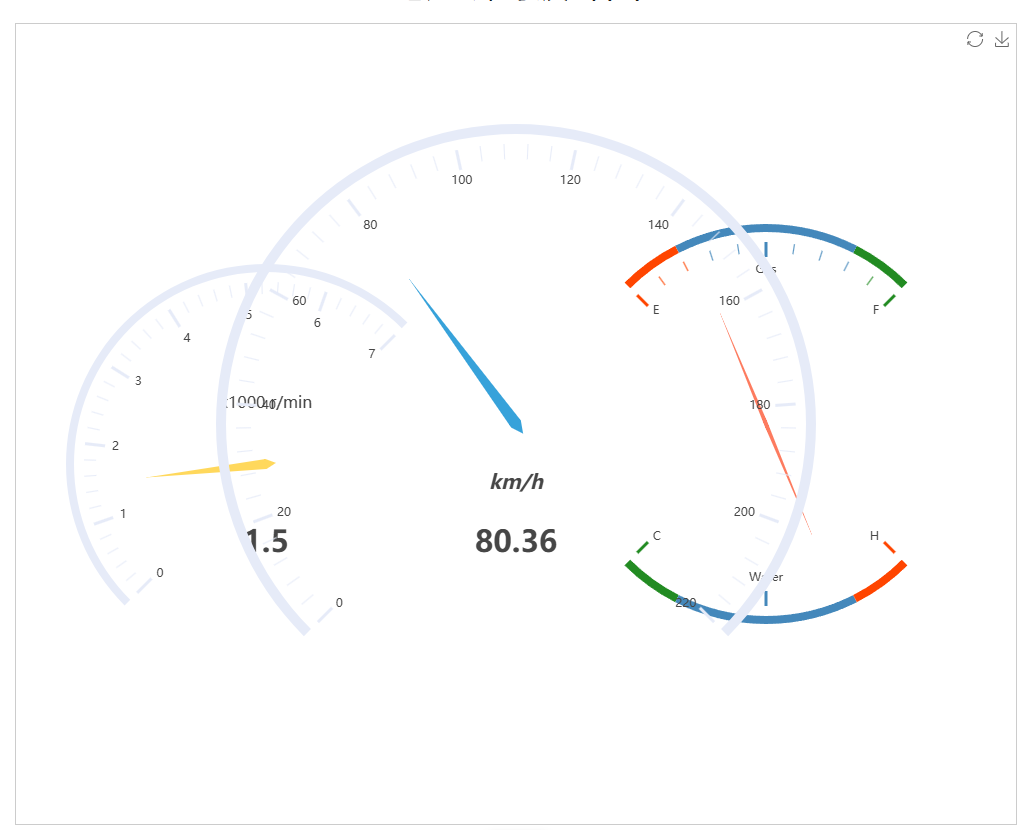
</style>仪表盘复杂版本
效果
代码
html
<!--
 * @Author: jsopy
 * @Date: 2025-05-07 14:22:57
 * @LastEditTime: 2025-05-08 15:39:58
 * @FilePath: /demo1/src/pages/index2.vue
 * @Description:
 *
-->
<template>
  <div class="page">
    <div class="title">电压瞬时波峰图</div>
    <div id="main"></div>
  </div>
</template>

<script setup>
  import * as echarts from "echarts";

  import { ref, onMounted, onBeforeUnmount, markRaw } from "vue";

  const myChart = ref(null);

  onMounted(() => {
    echartinit();
  });

  onBeforeUnmount(() => {
    window.removeEventListener("resize", function () {
      myChart.value.resize();
    });
  });

  const echartinit = () => {
    // 找到Echart元素
    const chartDom = document.getElementById("main");

    // 默认的时候支持light或者dark两种样式 必须引入markRaw 取消数据响应
    myChart.value = markRaw(echarts.init(chartDom, "light"));

    // 加载地图

    // 指定图表的配置项和数据
    // 指定图表的配置项和数据

    let options = {
      tooltip: {
        formatter: "{a} <br/>{c} {b}",
      },
      toolbox: {
        show: true,
        feature: {
          mark: { show: true },
          restore: { show: true },
          saveAsImage: { show: true },
        },
      },
      series: [
        {
          name: "速度",
          type: "gauge",
          z: 3, //谁的数值大就放在前面
          min: 0,
          max: 220,
          splitNumber: 11, //分成多少份
          axisLine: {
            // 坐标轴线
            lineStyle: {
              // 属性lineStyle控制线条样式
              width: 10,
            },
          },
          axisTick: {
            // 坐标轴小标记
            length: 15, // 属性length控制线长
            lineStyle: {
              // 属性lineStyle控制线条样式
              color: "auto",
            },
          },
          splitLine: {
            // 分隔线
            length: 20, // 属性length控制线长
            lineStyle: {
              // 属性lineStyle(详见lineStyle)控制线条样式
              color: "auto",
            },
          },
          title: {
            textStyle: {
              // 其余属性默认使用全局文本样式,详见TEXTSTYLE
              fontWeight: "bolder",
              fontSize: 20,
              fontStyle: "italic",
            },
          },
          detail: {
            textStyle: {
              // 其余属性默认使用全局文本样式,详见TEXTSTYLE
              fontWeight: "bolder",
            },
          },
          data: [{ value: 40, name: "km/h" }],
        },
        {
          name: "转速",
          type: "gauge",
          center: ["25%", "55%"], // 默认全局居中
          radius: "50%",
          min: 0,
          max: 7,
          endAngle: 45, //结束的角度
          splitNumber: 7, //分割的分数
          axisLine: {
            // 坐标轴线
            lineStyle: {
              // 属性lineStyle控制线条样式
              width: 8,
            },
          },
          axisTick: {
            // 坐标轴小标记
            length: 12, // 属性length控制线长
            lineStyle: {
              // 属性lineStyle控制线条样式
              color: "auto",
            },
          },
          splitLine: {
            // 分隔线
            length: 20, // 属性length控制线长
            lineStyle: {
              // 属性lineStyle(详见lineStyle)控制线条样式
              color: "auto",
            },
          },
          pointer: {
            width: 5,
          },
          title: {
            offsetCenter: [0, "-30%"], // x, y,单位px
          },
          detail: {
            textStyle: {
              // 其余属性默认使用全局文本样式,详见TEXTSTYLE
              fontWeight: "bolder",
            },
          },
          data: [{ value: 1.5, name: "x1000 r/min" }],
        },
        {
          name: "油表",
          type: "gauge",
          center: ["75%", "50%"], // 默认全局居中
          radius: "50%",
          min: 0,
          max: 2,
          startAngle: 135,
          endAngle: 45,
          splitNumber: 2,
          axisLine: {
            // 坐标轴线
            lineStyle: {
              // 属性lineStyle控制线条样式
              color: [
                [0.2, "#ff4500"],
                [0.8, "#48b"],
                [1, "#228b22"],
              ],
              width: 8,
            },
          },
          axisTick: {
            // 坐标轴小标记
            splitNumber: 5,
            length: 10, // 属性length控制线长
            lineStyle: {
              // 属性lineStyle控制线条样式
              color: "auto",
            },
          },
          axisLabel: {
            formatter: function (v) {
              switch (v + "") {
                case "0":
                  return "E";
                case "1":
                  return "Gas";
                case "2":
                  return "F";
              }
            },
          },
          splitLine: {
            // 分隔线
            length: 15, // 属性length控制线长
            lineStyle: {
              // 属性lineStyle(详见lineStyle)控制线条样式
              color: "auto",
            },
          },
          pointer: {
            width: 2,
          },
          title: {
            show: false,
          },
          detail: {
            show: false,
          },
          data: [{ value: 0.5, name: "gas" }],
        },
        {
          name: "水表",
          type: "gauge",
          center: ["75%", "50%"], // 默认全局居中
          radius: "50%",
          min: 0,
          max: 2,
          startAngle: 315,
          endAngle: 225,
          splitNumber: 2,
          axisLine: {
            // 坐标轴线
            lineStyle: {
              // 属性lineStyle控制线条样式
              color: [
                [0.2, "#ff4500"],
                [0.8, "#48b"],
                [1, "#228b22"],
              ],
              width: 8,
            },
          },
          axisTick: {
            // 坐标轴小标记
            show: false,
          },
          axisLabel: {
            formatter: function (v) {
              switch (v + "") {
                case "0":
                  return "H";
                case "1":
                  return "Water";
                case "2":
                  return "C";
              }
            },
          },
          splitLine: {
            // 分隔线
            length: 15, // 属性length控制线长
            lineStyle: {
              // 属性lineStyle(详见lineStyle)控制线条样式
              color: "auto",
            },
          },
          pointer: {
            width: 2,
          },
          title: {
            show: false,
          },
          detail: {
            show: false,
          },
          data: [{ value: 0.5, name: "gas" }],
        },
      ],
    };

    myChart.value.setOption(options);
    // 监听改变大小
    window.addEventListener("resize", function () {
      myChart.value.resize();
    });
    clearInterval(timeTicket);
    var timeTicket = setInterval(function () {
      options.series[0].data[0].value = (Math.random() * 100).toFixed(2) - 0;
      options.series[1].data[0].value = (Math.random() * 7).toFixed(2) - 0;
      options.series[2].data[0].value = (Math.random() * 2).toFixed(2) - 0;
      options.series[3].data[0].value = (Math.random() * 2).toFixed(2) - 0;
      myChart.setOption(options, true);
    }, 2000);
  };
</script>

<style lang="scss" scoped>
  .page {
    overflow: hidden;
    .title {
      font-size: 16px;
      color: black;
      margin: 0 auto;
      text-align: center;
      font-size: 36px;
    }
    #main {
      width: 1000px;
      height: 800px;
      border: 1px solid #ccc;
      margin: 0 auto;
      margin-top: 20px;
    }
  }
</style>